
An email report is useful only when it changes the next campaign decision. A strong open rate cannot rescue a weak offer, and a high click rate does not create value if the landing experience fails to convert.
Use the calculator above for the arithmetic, then work through the funnel below. The goal is not to label one number good or bad in isolation. It is to find the earliest stage where expected recipients stop progressing.
Use the right denominator for each question
A rate is a numerator divided by the population that had the opportunity to produce it. Delivery uses sent messages. Opens and clicks use delivered messages. Click-to-open uses unique opens. Click conversion uses unique clicks. Changing denominators makes comparisons misleading.
Document whether a system reports unique people or total events. Repeated opens and clicks can inflate event totals, while privacy and mailbox behavior can affect tracking. Keep the definition stable across the campaigns you compare.
Delivery rate = delivered / sent
Open rate = unique opens / delivered
Click rate = unique clicks / delivered
Click-to-open rate = unique clicks / unique opens
Click conversion rate = conversions / unique clicks
Campaign ROI = (attributed revenue - campaign cost) / campaign cost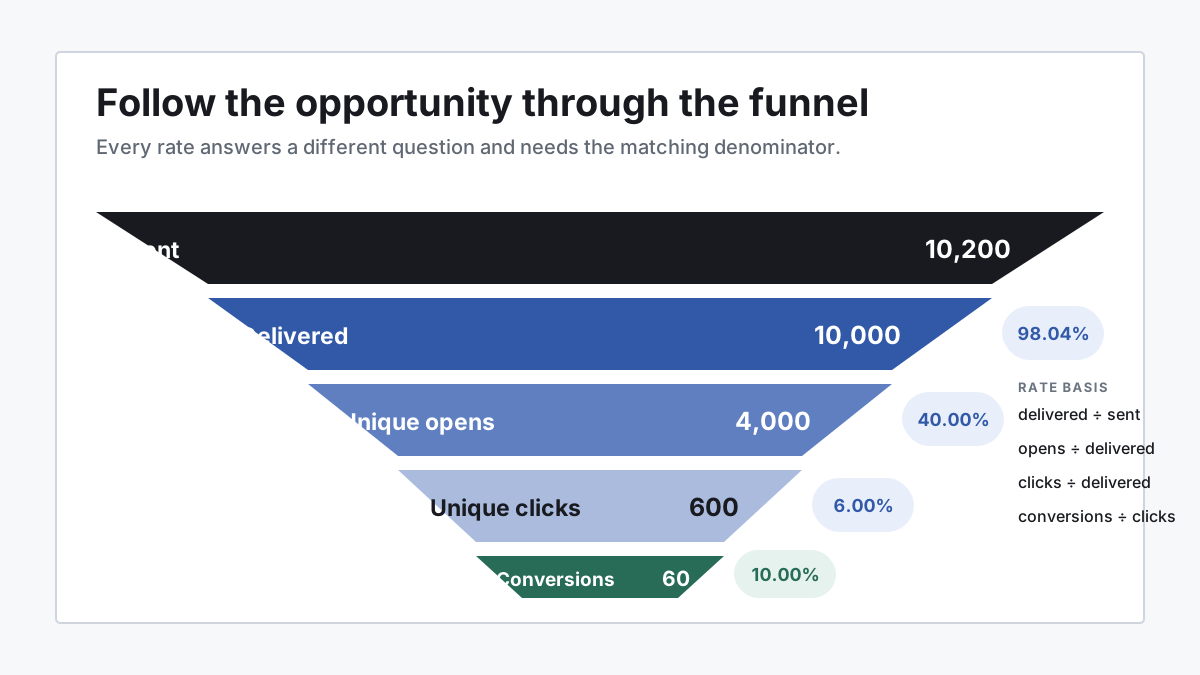
Start with eligibility and delivery
Before judging creative, confirm that the intended audience was eligible and that messages were accepted for delivery. Review invalid addresses, hard and transient bounces, suppression, complaints, authentication, volume changes, and provider delivery errors.
A delivered event means the receiving system accepted the message; it does not guarantee primary-inbox placement or attention. Use mailbox-provider tools, including Google Postmaster Tools for Gmail traffic, alongside sending-platform events.
- Unexpectedly low sent total: inspect eligibility, suppression, scheduling, and capacity rules.
- Low delivery rate: inspect address quality, authentication, bounces, reputation, and volume patterns.
- Rising complaints or unsubscribes: inspect audience expectation, frequency, relevance, and opt-out handling.
Treat opens as a directional diagnostic
Open tracking generally depends on a remote image, so blocking, caching, prefetching, text-only clients, and privacy behavior can change the count. Google states that it does not track open rates and cannot verify third-party open-rate accuracy.
Use opens to compare similar campaigns under a stable measurement setup. If delivery is healthy but opens move sharply, inspect sender recognition, subject-message alignment, timing, and whether the audience expected the email. Do not optimize a business outcome around opens alone.
Use clicks to judge message-to-action fit
Click rate asks whether delivered recipients acted. Click-to-open asks whether people who appeared to open found the message and CTA compelling enough to continue. The second metric inherits the limitations of open tracking, so read it as a directional comparison.
Inspect clicks by link and recipient segment. A high total can hide that recipients chose a secondary navigation link instead of the intended CTA. Use descriptive tracking labels and preserve the campaign version that produced the event.
- Low clicks after stable delivery and opens: test relevance, offer clarity, CTA prominence, and message length.
- Clicks concentrated on a secondary link: align the primary CTA with what recipients are actually seeking.
- One segment underperforms: inspect its eligibility rule, context, fallback, and specific message version.
Define conversion before attributing it
A conversion should represent the campaign job: completed signup, qualified meeting, purchase, adoption step, renewal action, or another verified outcome. Page visits are useful events but may not be conversions.
Choose an attribution rule before looking at results. Record the window, eligible touchpoints, deduplication method, and treatment of conversions that would likely have happened without the email. Use controlled tests when the decision warrants stronger evidence.
Calculate ROI with honest cost and value
Campaign cost includes more than software spend. Count audience preparation, creative, review, deliverability work, offers or discounts, and the share of platform or service cost attributable to the campaign. Revenue should be attributed consistently and adjusted when returns or cancellations matter.
For retention, onboarding, and adoption campaigns, immediate revenue may be the wrong value measure. Track the verified customer outcome first, then use a documented model if the team connects that outcome to retained or expanded value.
Attributed revenue: 6,000
Campaign cost: 600
ROI = (6,000 - 600) / 600 = 900%

The arithmetic is exact; the attribution assumptions still require review.
Separate influenced revenue from incremental lift
Influenced revenue links an eligible email action to a later conversion under a stated attribution rule. It is useful operationally, but it does not prove that the email caused the outcome. Some recipients would have converted without the campaign.
Incremental lift compares the eligible action cohort with a similar holdout that did not receive the action. Assign the cohort before results are known, keep eligibility and measurement windows stable, protect consent and customer experience, and report small samples as directional rather than conclusive.
- Influenced value: outcomes linked to an eligible completed action
- Holdout outcome: what happened among comparable eligible recipients without the action
- Lift: the difference between action and holdout outcome rates
- Guardrails: complaints, unsubscribes, negative replies, and review defects
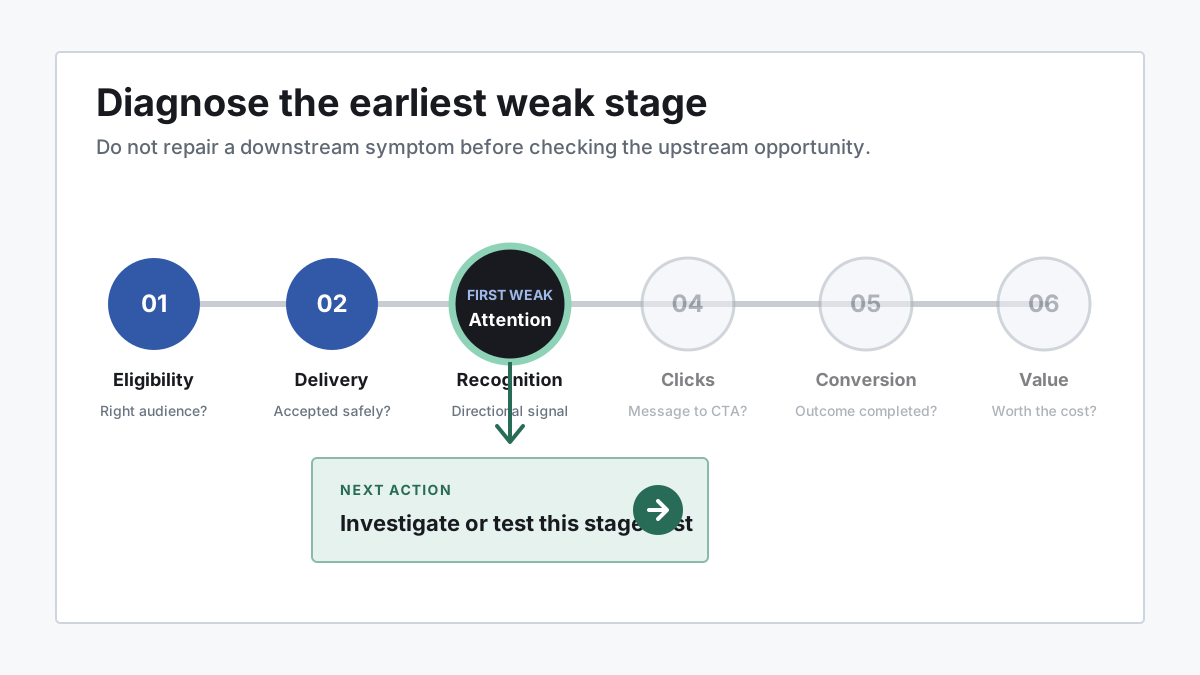
Diagnose the earliest weak stage
Choose the next experiment at the earliest stage that is clearly weak. Changing the CTA cannot repair invalid addresses, and rewriting the subject line cannot repair a landing page that fails after the click.
- Confirm that the intended, permission-appropriate audience became eligible.
- Confirm delivery, authentication, suppression, complaint, and bounce health.
- Use opens only as a directional check on recognition and expectation.
- Inspect unique clicks and the specific links recipients chose.
- Verify the landing or reply experience and qualified conversion event.
- Calculate business value and campaign cost with documented attribution assumptions.
Run one interpretable test at a time
State a hypothesis, primary metric, guardrail, audience, and decision rule before launch. Keep the campaign versions and recipient assignments so the result can be explained later.
A useful test changes a meaningful variable: audience rule, value proposition, proof, CTA, timing, or personalization signal. Tiny wording changes can be valid, but they should not become a substitute for fixing a weak campaign strategy.
Hypothesis: renewal-stage value evidence will increase planning calls
Primary metric: qualified meetings / delivered emails
Guardrails: complaint, unsubscribe, and review-defect rates
Audience: eligible customers 45-60 days before renewal
Decision: adopt only if outcome improves without harming guardrails